Uptime monitoring with UptimeFlare and Globalping
Another day, another announcement: we're happy to let you know that the open-source uptime monitoring and status page solution UptimeFlare now supports Globalping for global uptime checks.
In this post, we'll show what this integration does, why it matters, and how you can use it to run uptime checks from anywhere in the world, powered by Globalping's distributed probe network.
This integration was built by the UptimeFlare developer, @lyc8503, not by the Globalping team. We just think it's great and worth highlighting.
Why use Globalping with UptimeFlare
Before we get into the integration, here's a quick refresher on both tools:
- UptimeFlare is a serverless, open-source monitor and status page generator, powered by Cloudflare Workers.
- Globalping is an open-source network measurement platform that lets you run tests (such as ping, mtr, traceroute, and DNS lookup) from thousands of probes distributed around the globe, including residential ISPs and cloud networks.
The challenge
An UptimeFlare user pointed out that some of their uptime results were inconsistent because Cloudflare's network was unstable or even blocked in some regions. Since UptimeFlare runs on Cloudflare Workers by default, all monitoring traffic originates from Cloudflare's network, and some services may limit or reject traffic from it, which means the results weren't always reliable across regions.
The solution
By integrating Globalping, UptimeFlare can now run checks via Globalping's distributed probe network rather than relying solely on Cloudflare's infrastructure.
This gives you:
- uptime checks from regions that are important to your users
- checks from different network types, such as residential or datacenter networks
- monitoring that reflects real user experience worldwide
- fine-tuned location picking using the
magicparameter to target specific regions, cities, or ISPs (for example:CN,US+eyeball-network, oreurope+aws)
How to use UptimeFlare with Globalping
Step 1: Create a Globalping account
Create a free account on the Globalping Dashboard and generate a token to authenticate your checks and get 500 free tests per hour:
- Go to the Globalping Dashboard and sign up with your GitHub account
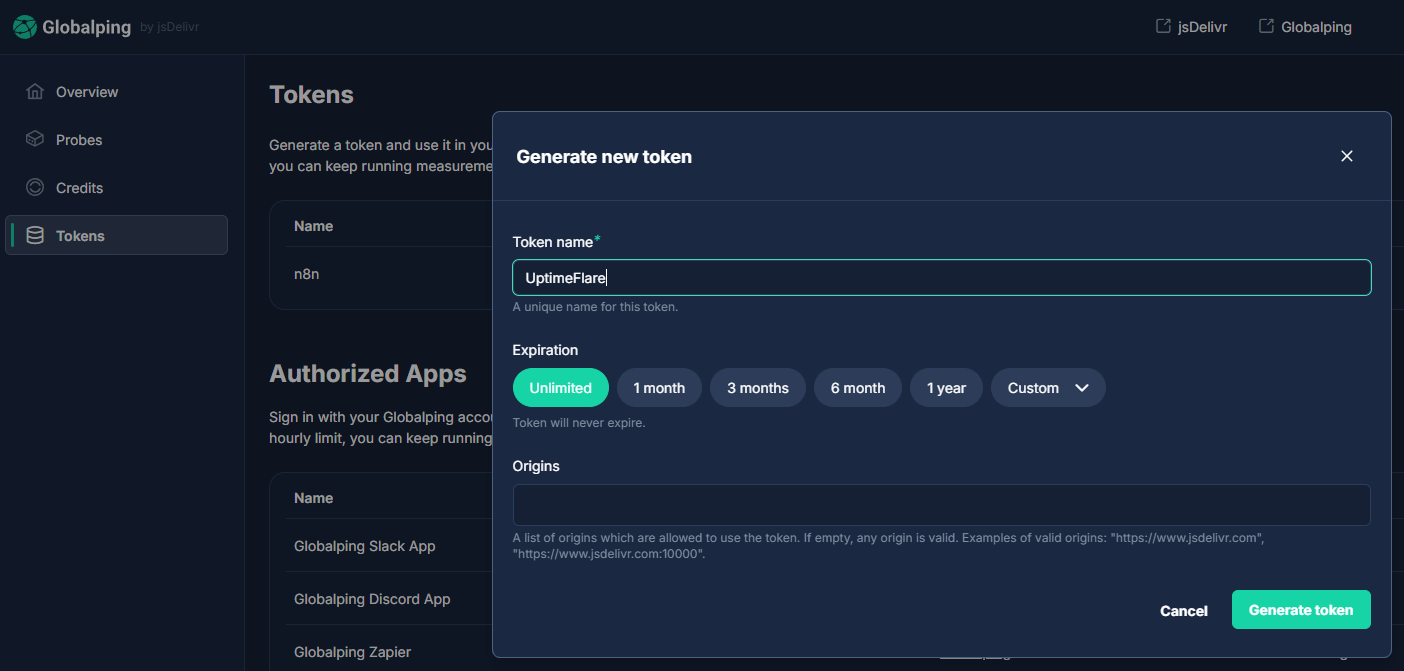
- Once you're logged in, go to "Tokens" and click "Generate new token"
- Copy the token and put it somewhere safe since you won't be able to see it again
Step 2: Add Globalping to your UptimeFlare config
In your UptimeFlare config file uptime.config.ts, use the globalping:// scheme, followed by your token, as the value for checkProxy.
For example, this could look something like this:
{
  id: 'globalping',
  name: 'Globalping',
  method: 'GET',
  target: 'https://globalping.io/',
  checkProxy: 'globalping://abcdef123456/?magic=US'
}
This configuration tells Globalping to use available probes from the US. If you don’t provide a magic value, the platform will randomly select locations around the world.
We’ll explore some more configurations to define locations in a moment.
Step 3: Save and deploy
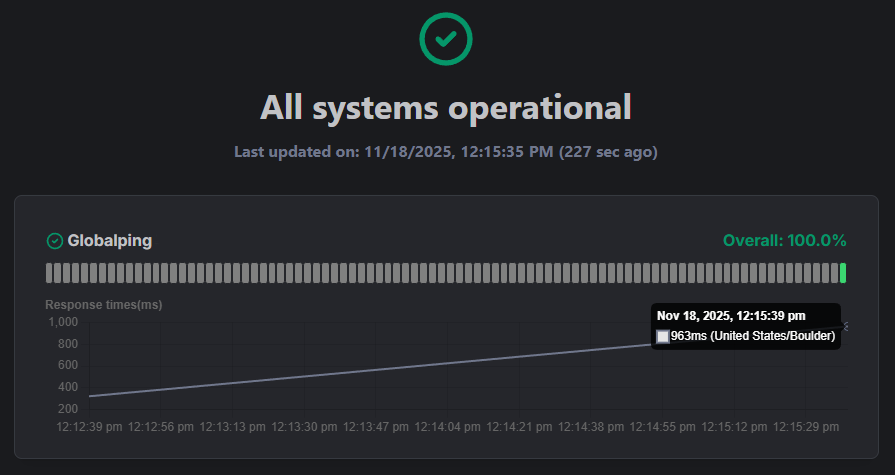
Once you've added the configuration, wait for GitHub Actions to redeploy as usual. Next, take a look at your UptimeFlare status page, and see the first uptime checks performed through Globalping's probe network coming in:
Example configurations
Let's take a look at some more example configurations to help you get started:
Target a specific region
To run checks from a specific country, region, or network, use the magic parameter. This gives you control over the location from which you want to originate the monitoring traffic.
For example, to run checks from France, use:
checkProxy: 'globalping://abcdef123456/?magic=FR'To run checks from Paris, use:
checkProxy: 'globalping://abcdef123456/?magic=Paris'Target specific network types
The magic parameter supports various other location types, including tags for specific network types. At the moment, Globalping supports the tags eyeball-network and datacenter-network.
For example, to monitor from a random eyeball network, use:
checkProxy: 'globalping://abcdef123456/?magic=eyeball-network'Fine-tune probe selection with filters
You can use the + character to create filters to define probe selection location more granularly.
+ character. For example, 'globalping://abcdef123456/?magic=US%2AWS'For example, to check from an eyeball network in France, use:
checkProxy: 'globalping://abcdef123456/?magic=FR+eyeball'Or, to check from an AWS probe in the US, use:
checkProxy: 'globalping://abcdef123456/?magic=US+AWS'Use IPv4 or IPv6
By default, Globalping uses IPv4, but if your monitoring target is IPv6-only, you can set the ipVersion parameter to 6 in your checkProxy value.
For example, to define a magic location and target IPv6, use:
checkProxy: 'globalping://abcdef123456/?magic=US&ipVersion=6'Conclusion
With the new Globalping integration, UptimeFlare users can run uptime checks from anywhere in the world using Globalping's global network of probes.
The integration is completely optional, and you can continue using Cloudflare or other checkProxy setups. But it's a great option if you want more control over where your checks originate or if you're running into location-based issues with other proxies.
We're excited to see a developer bring Globalping into UptimeFlare, and the Globalping team is genuinely happy to see the project used in this way.
Check out the integration on the UptimeFlare GitHub repository!