Global network testing inside your editor with Globalping's VS Code extension

At the end of the year, we have one final announcement: you can now use Globalping directly in VS Code and its forks, such as Cursor.
The Globalping extension lets you run network tests right from your editor to help you debug connectivity, check performance, test DNS resolution, and more. Instead of switching to an external tool or terminal every time you want to run a measurement, you can stay in your flow and get results where they matter.
In this blog post, we’ll show you how to install the extension, the different ways to use it, and some real-world use cases to make your life a little bit easier.
What can the Globalping VS Code extension do for you?
Let me first introduce you to Globalping in case you're new: Globalping is an open-source network measurement platform that lets you run tests like ping, traceroute, HTTP, mtr, and DNS from virtually any location in the world. Our goal is to make network testing accessible to everyone through tools like our web form, CLI, Slack app, and MCP server.
We built this extension for devs who want to integrate network testing into their daily workflows. It’s also a great tool for admins, DevOps engineers, and at-home users who use VS Code to manage configuration files and documentation.
Main features:
- Supports all Globalping test types: use ping, HTTP/HTTPS, DNS lookup, traceroute,s and mtr
- Test from anywhere: run tests from any of the 3,000+ probes in our global network
- Built for developers: interact via right-click, the command palette, or the sidebar panel
- Reusable tests and targets: re-run recent tests or save frequent targets to your favorites for one-click testing
- Clean results: receive nicely formatted, easy-to-read results directly in your editor
- Open source & fork compatible: fully open source and compatible with VS Code forks like Cursor
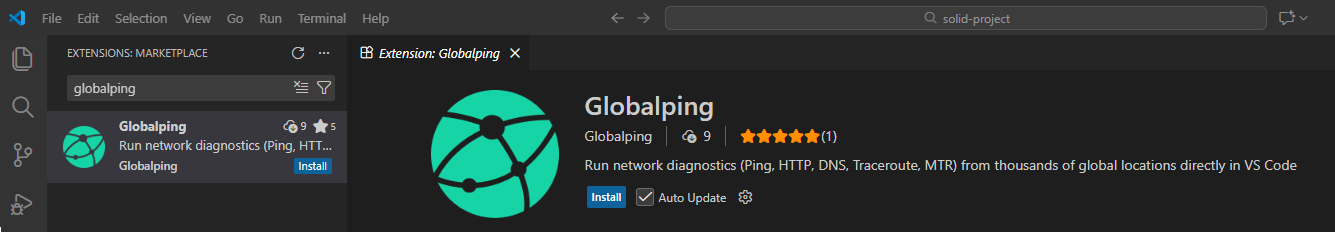
Installing the extension
Globalping is available as an official extension in the Visual Studio Marketplace. You can install it directly within your IDE:
- Open VS Code
- Go to Extensions (
Ctrl+Shift+XorCmd+Shift+Xon Mac) - Search for Globalping
- Click the "Install" button
Using the extension
There are three main ways to interact with the extension. Let's try them out.
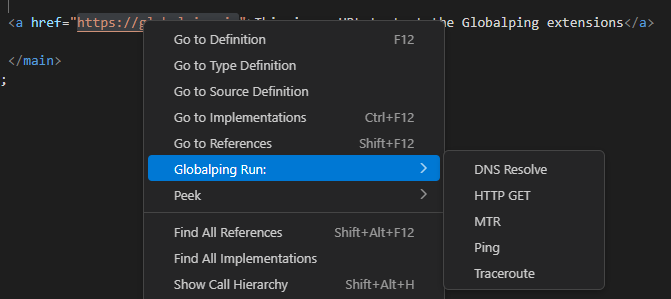
1. Right-click testing
This is the fastest way to test a target in your code or documentation:
- Highlight any URL, domain, or IP address in your file
- Right-click and hover over "Globalping Run:" to see available test types
- Select your test, and the results will appear in your editor’s output window
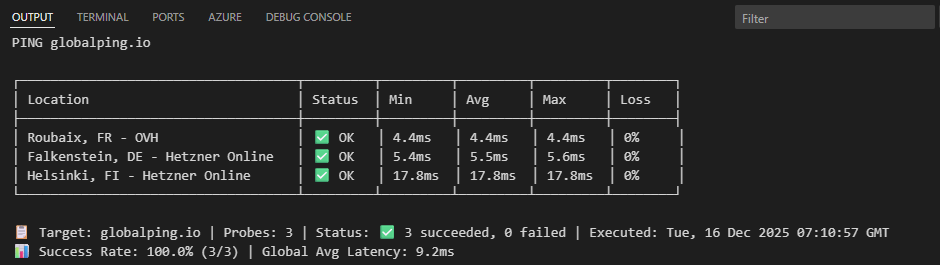
For example, here is a ping against the Globalping website:
2. Command palette
If you prefer running commands with your keyboard, then this option is a great way to run fine-tuned tests:
- Open the command palette (
Ctrl+Shift+PorCmd+Shift+Pon Mac) - Type and select "Globalping: Run New Test"
- Follow the prompts to select your test type, target, location (e.g., a specific country or ISP), and how many probes you want to use
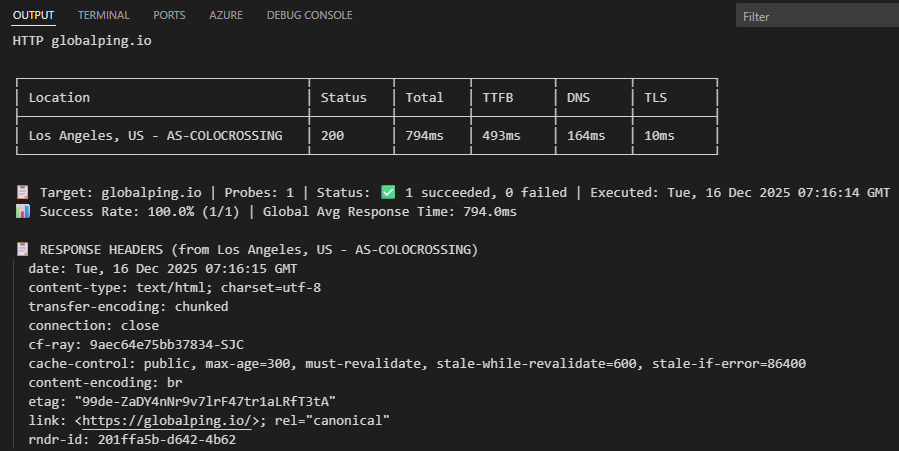
Here is an HTTP test running from California using a single probe:
3. Sidebar Panel
If you prefer a more visual approach to testing, you can run tests by filling out a form in the sidebar of your editor:
- Click on the Globalping icon in the Activity Bar
- Fill out the form to configure your test
- Click "Show advanced settings" to see more config options, including specific options for the selected test type.
- Click the "Run Test" button
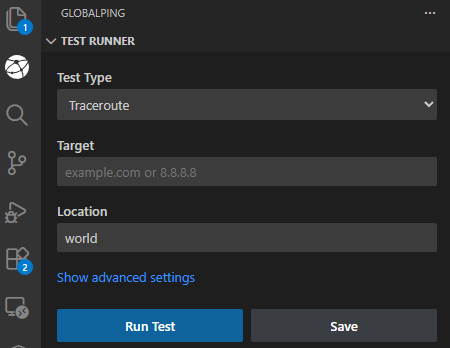
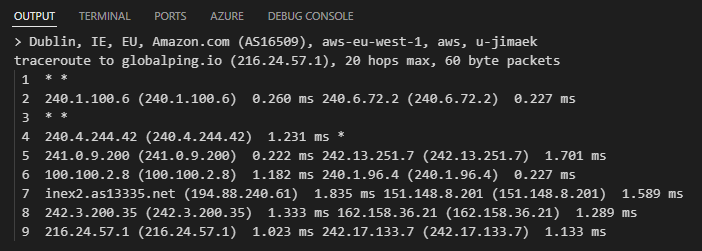
In this example, I ran a traceroute from the aws-eu-west-1 region with raw results enabled:
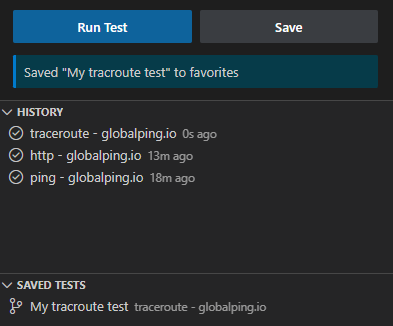
Re-running and saving tests
- Last tests: Quickly repeat your previous measurements via the command palette with "Globalping: Run Last Test".
- Favorites: Click “Save” in the side panel when creating a test to add frequent measurements to your favorites.
- History: View and re-run any previous tests from the history tab in the sidebar.
Authenticate to unlock more free tests
You can use the Globalping VS Code extension without an account, but authenticating is 100% free and greatly increases your free tests per hour:
- Register at https://dash.globalping.io/
- In the dashboard, go to "Tokens" and click "Generate a new token"
- Copy the token (you won't be able to see it again!)
- In VS Code, open the Globalping sidebar panel and click "Add API Token"
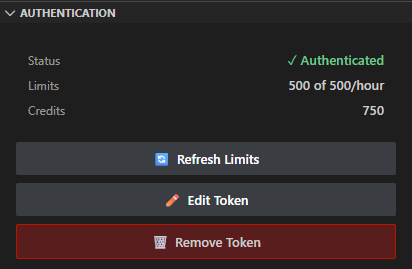
At the time of writing, Globalping gives you 250 free tests per hour for unauthenticated requests, while authenticated users get 500. Remember that each probe used in a measurement counts as one test. For example, if you run a measurement that runs ping from three probes, this counts as three tests.
Example use cases
Finally, let's look at some specific scenarios where having Globalping inside VS Code can come in handy for you:
"Is it down?" tests
Can't reach your API endpoint or website, and wonder if it's just you? Run a ping or HTTP test from multiple locations worldwide, including regions where you suspect connectivity issues, to see if the target is reachable. This helps you plan your next troubleshooting steps accordingly.
Verify newly deployed environments
After setting up a new dev, staging, or production environment, you need to know if it’s reachable worldwide. Run HTTP tests from various locations after launch to catch firewall misconfigurations, routing errors, or deployment issues right away.
Debug regional user issues
When users from a specific part of the globe report performance issues, you can troubleshoot directly from your editor. Run ping tests to check latency, HTTP to check response times, and traceroute or mtr to identify routing bottlenecks. By defining the user’s location as the origin, you can diagnose network problems that would otherwise require a remote server, a VPN to replicate them, or you being physically there with your laptop.
Verify DNS propagation
When you update records, you often have to wait and wonder if the changes have already propagated globally. Run DNS tests from different countries to get clear results and catch any inconsistent or stale records.
Conclusion
We hope the Globalping VS Code extension makes your development and debugging sessions much smoother.
As always, this integration is open source, and we’d love to hear your feedback or feature ideas in our GitHub repository.
Ready to try it out? Download the extension from the VS Code Marketplace and let us know what you think!