Get performance metrics of any website or app
Making sure your web app is fast is crucial to providing users with an excellent experience and keeping them happy. It doesn't matter if you're running a website, an API, or using edge computing services or CDNs – speed is key.
But before you can improve your web app's speed, you need to measure its current performance. While testing from one location, such as your laptop, is relatively straightforward, it's important to explore how users in other locations experience your web app. The question is: how can you do that if you don't have access to these locations?
That's where Globalping comes in, our free network measurement platform with which you can run tests from any location using a vast network of probes. With Globalping, you can run various test types, including HTTP, which is like curl and provides useful insights into your web app's performance.
In this article, we'll explore how you can use Globalping to test the performance of any web app from any location. We'll talk about the test result's performance metrics and give you some examples of when it's especially helpful to check your app's performance from different locations.
How to run HTTP tests with Globalping
Globalping provides you with a range of tools to run tests in a consistent way. Regardless of the tool you use, whether it's the CLI tool or Slack app, you can expect a consistent experience.
To start, let's perform an HTTP test with our website tool, which is the easiest to use regardless of your technical abilities. After that, we'll use the CLI tool to perform the same test so you can also see how that works.
Using the Globalping website tool
To run a test, go to our website and find the form at the top of the page. Fill it with the data you want to test, and make sure to choose "HTTP" as the test type.
Tip:
If you want to learn more about providing location data, check out our best practices on GitHub.
When you're ready, click on the "Run Test" button. You should receive the test results immediately, which will look similar to this one:
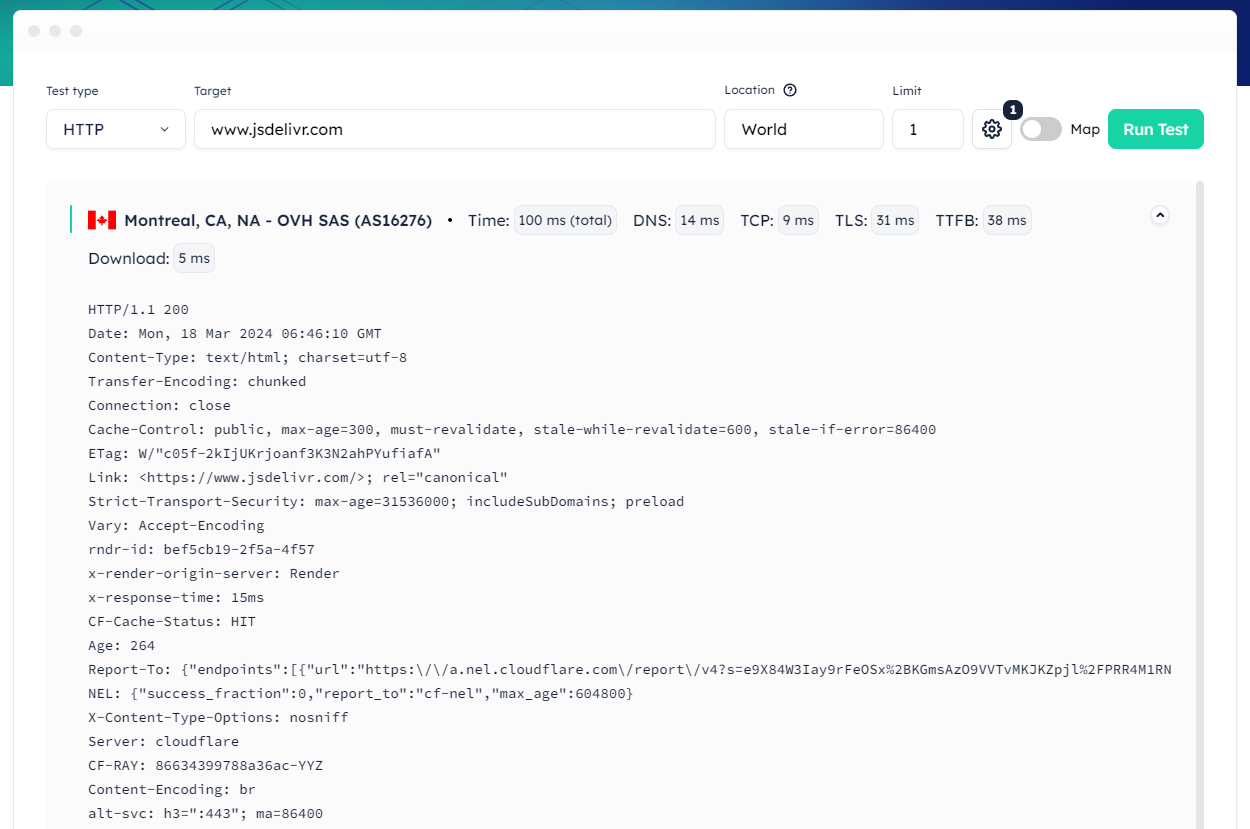
If you can't locate the timings data: it's right at the top right corner next to the probe location info. In the example above, the total time is 100 ms.
Using the Globalping CLI tool
Make sure you have our CLI tool installed and updated before we start. Then, follow these steps:
- To replicate the command created earlier, use the following command:
globalping http https://www.jsdelivr.com from world—-limit 1 - Once you execute the command, you should get the result pretty quickly, and it should look similar to what you received in the web form.
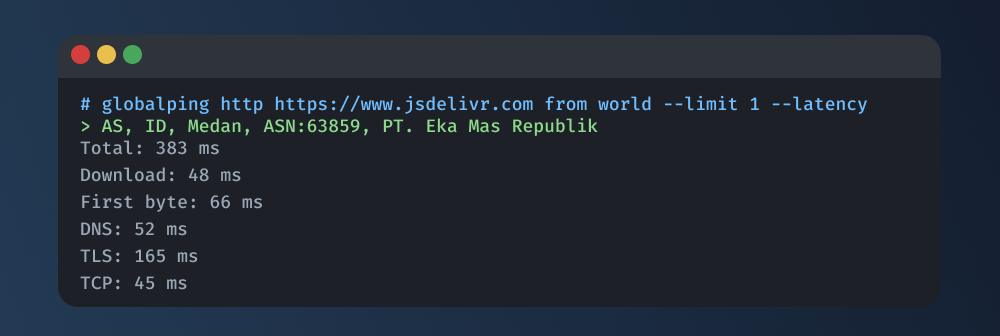
- Since we're only interested in the timing data, we can use the
--latencyoption with our command:globalping http https://www.jsdelivr.com from world --limit 1 --latency - Now, the result should look something like this:
Tip:
If you use the --json option or directly use the API to run measurements, you'll get the test result in JSON. There, you can find a timings object for each test containing the performance data.
Using other Globalping tools
You can use a few different tools to run your measurements with Globalping:
Slack app
If you prefer Slack, you can type in the command using its forward-slash syntax. Something like:/globalping http https://www.jsdelivr.com from world --limit 1 --latency
GitHub bot
You can mention the bot in any public GitHub issue like this:@globalping http https://www.jsdelivr.com from world --limit 1 --latency
But no matter which tool you use, the command format and result will be similar. This makes it easy to switch between tools, such as when you work alone in your terminal or collaborate with your team in Slack!
Understanding Globalping's HTTP performance metrics
Examining Globalping's HTTP performance metrics can provide you with helpful insights into the different stages of your web app's request-response cycle. This lets you identify potential bottlenecks and optimize your application's performance effectively. Let's take a closer look at the timing data in the following example result to gain a better understanding.
   Total: 383 ms
   Download: 48 ms
   First byte: 66 ms
   DNS: 52 ms
   TLS: 165 ms
TCP: 45 ms - Total: The total time taken for the entire request-response cycle, from when the request is sent to when the complete response is received, is referred to as "Total." This metric provides an overall view of website performance.
- Download: The download time is how long it takes to get the response body from the server after connecting. In this case, it took 48 milliseconds, which is good because it shows that the data transfer and server performance are efficient and running smoothly.
- First Byte: The first byte time measures the time it takes for the server to send the first byte of the response after getting a request. This measures how fast the server is at responding initially and can indicate some delay in processing on the server side.
- DNS: This metric represents the time it takes for the Domain Name System (DNS) resolution, which translates domain names into IP addresses. A quick DNS time means the DNS resolution process is efficient, while a slower one can tell the DNS server is experiencing some delay.
- TLS: "TLS" refers to the time it takes to establish a secure connection between the client and the server. This is done through the TLS handshake, which involves exchanging keys, setting up encryption, and verifying the web app's identity. A lower TLS time usually indicates that the process is efficient.
- TCP: This measures the time it takes to set up a TCP (Transmission Control Protocol) connection between a client and a server. It covers the handshake process, where both sides agree on how to connect. In this instance, TCP time is 45 milliseconds, suggesting a smooth network connection and efficient handshake process.
Use cases for checking performance data from different locations
Let's explore some handy use cases for checking performance data from different locations using Globalping:
Ensuring a consistent UX
One big reason for checking performance data from different locations is to ensure users can have a good experience using your website or app, no matter where they are. Factors like how close users are to servers and differences in regional infrastructure can affect how fast a website or app feels for them. Testing the performance from different locations allows you to spot performance issues and optimize your web app to work smoothly for everyone. Also, websites that load quickly are more likely to rank higher in search engines.
Assessing CDN performance and choosing the best provider
Content Delivery Networks (CDNs) are essential for quickly delivering web content to users worldwide. They do this by keeping content on servers closer to users, making it faster to access. Checking how well CDNs perform from different locations can help you see how quickly they deliver content across different areas. With Globalping, you can compare performance stats from different CDNs, which enables you to figure out which one works the best for what you need.
Evaluating edge computing performance and comparing providers
Edge computing moves processing closer to where data is created, making it faster and reducing application latency. By analyzing performance data from different locations, you can evaluate how effective your edge computing infrastructure is in delivering services to users worldwide. Additionally, you can compare different edge computing providers in one location to figure out which one works best for your needs.
Detecting and measuring cold starts of FaaS and edge computing services
Cold starts happen when serverless functions (FaaS) or edge computing instances need to be initialized, resulting in increased response times and potential performance issues. By identifying and measuring cold starts from various locations, you can learn about how they affect your app's performance. Then, you can start pinpointing the factors contributing to cold starts and try fixing them, such as slow provisioning and inefficient use of resources. With these changes, you can make cold starts happen less often and keep your app running smoothly.
Conclusion
So, now that you know how to check the performance of your web apps from different parts of the world using Globalping, understand the data, and what you can do with it, we hope you're ready to start testing your web apps and improving their performance!
If you want to learn more about using Globalping effectively, visit our blog and check out our best practices on GitHub.